
The completion factor method is widely regarded as the industry standard for estimating healthcare claims reserves. It follows the assumption that, given sufficient volume and maturity, historical claims predict future payment patterns.
That assumption is only as reliable as the data behind it. Large claims and other outliers can distort a development pattern and pull the resulting reserve estimate away from a reasonable value. Adjusting for outliers is therefore a standard part of the reserving process.
This article walks through where outliers appear in the completion factor workflow and the techniques actuaries use to address them, both the algorithmic rules that can be applied at scale and the visual tools that keep a human in the loop.
Why Outliers Matter#
The completion factor method builds a lag triangle, computes age-to-age development factors, averages those factors within each lag, and projects recent incurred periods to their ultimate value. Every one of those steps compounds. An anomaly in a single cell flows into a development factor, which flows into a selected average, which flows into an age-to-ultimate factor applied across an entire incurred period.
Because recent incurred months rely on the earliest, least mature lags, they are the most sensitive to distortion. A distorted factor in an early lag is multiplied through a long chain of subsequent factors, so the dollar impact on the least developed periods, which also carry the largest reserves, is the greatest.
The goal of outlier adjustment is not to erase real experience. It is to prevent a non-representative data point from being treated as if it were a stable, repeatable pattern.
Smoothing Age-to-Age Factors#
The most familiar form of outlier handling happens at the averaging step. Smoothing techniques are commonly applied to age-to-age factors, with averaging methods helping to mitigate the impact of outliers. This type of smoothing is routine and is often the first line of defense.
Two common approaches:
- A simple average assigns equal weight to every factor in a lag column. It is transparent but remains fully exposed to any extreme value in the sample.
- A medial average (for example, a "4 of 6" average) drops the highest and lowest factors before averaging the rest, directly reducing the influence of outliers.
Restricting the sample to a limited number of recent periods can further reduce the weight given to an old anomaly, at the cost of using fewer data points. The choice among these methods is one of the more consequential judgment calls in reserving, because different selections can yield materially different estimates when anomalies are present.
Adjusting the Lag Triangle Directly#
Smoothing operates on the factors. Sometimes the anomaly is better addressed in the triangle itself. Directly adjusting cells in a lag triangle is also common in practice. Techniques may include:
- Zeroing out outlier cells: Replace an anomalous incremental value with zero (or exclude it) so it no longer contributes to the development pattern for that lag.
- Using average values from adjacent cells: Substitute the outlier with a value interpolated from neighboring cells along the same diagonal or duration, preserving the overall shape of the runoff.
- Adjusting the source data: Modify or filter the underlying claim records before they are summarized into the triangle, so the triangle is built clean from the start.
Each of these targets a different point in the pipeline. Zeroing and averaging edit the summarized triangle after it is built, while source adjustment intervenes earlier, before the data is ever aggregated.
Algorithmic Adjustment#
While the methods above can all be implemented algorithmically, in practice, they are often adjusted on a case-by-case basis. Automation and judgment are not mutually exclusive. An effective workflow uses rules to surface flag outliers and leaves the final decision to the actuary.
For cell-level techniques such as zeroing or averaging, z-scores can be calculated along a diagonal and cells automatically adjusted when they exceed a chosen threshold, such as 2.5 standard deviations above the mean. The z-score expresses how far a value sits from the mean of its comparison group in units of standard deviation, which makes it a natural, scale-independent trigger for flagging anomalies.
If claim level data is available, a simpler rule may suffice: large claims above a given amount, such as $250,000, can be filtered out before being populated into the lag triangle. Catastrophic or shock claims may follow a different payment pattern than routine claims and can be reserved separately.
A value that trips the rule may still be legitimate experience, and a value that stays under the threshold may still warrant a closer look. This is why visual review remains an essential companion to the algorithms.
Visual Tools for Identifying Anomalies#
Visual tools can play an important role in surfacing patterns and outliers that a threshold might miss:
-
Colored gradients along the lag triangle diagonals make it easy to spot a cell that breaks from its neighbors, because an anomalous value shows up as a color that does not belong to its surroundings.
-
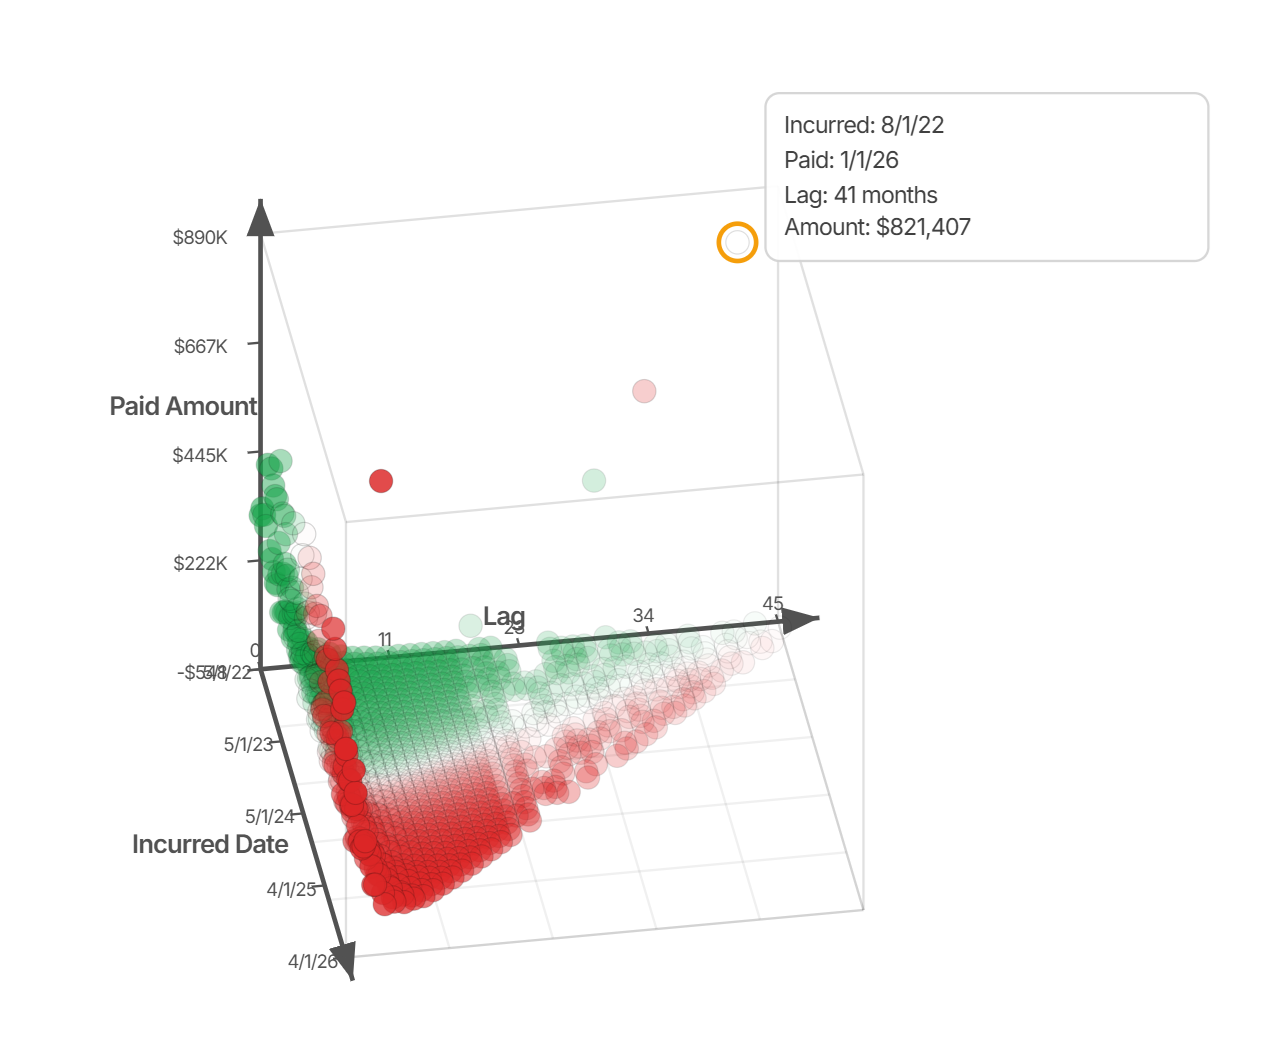
3-D plots by duration, incurred date, and amount reveal the shape of the runoff surface and expose spikes that would be invisible in a flat table.
-
Payment amounts by month and duration help distinguish a genuine seasonal or operational pattern from a one-off distortion.
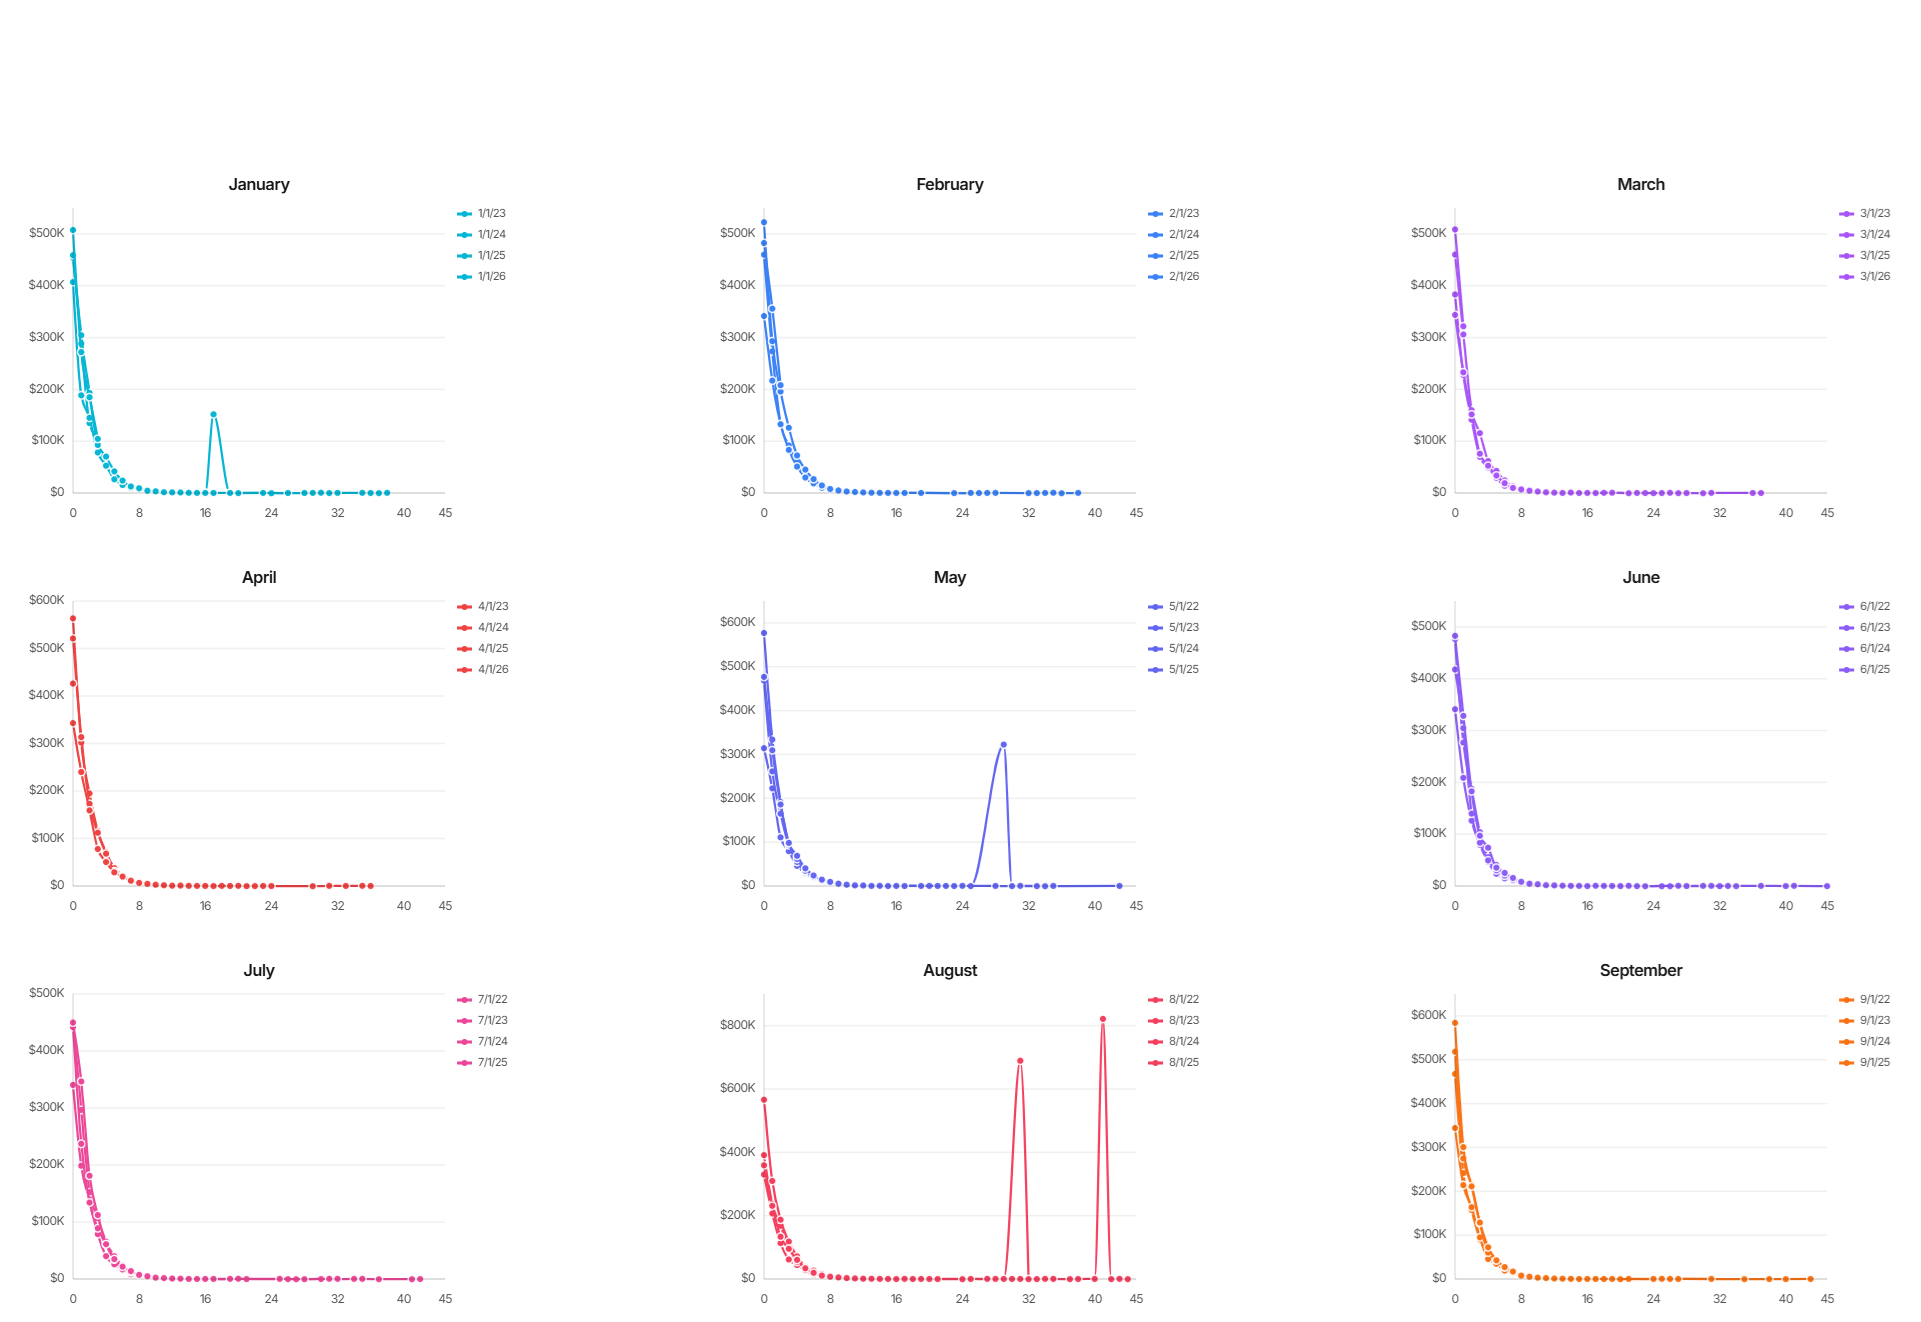
Used together, the gradient view answers "which cell looks wrong," the 3-D surface answers "how wrong, and in what direction," and the month-by-duration view answers "is this a pattern or a fluke." Each view tends to catch a different class of anomaly, which is why reviewing more than one is worthwhile.
Combining Algorithms and Human Review#
Modern reserving platforms such as IBNR Health integrate both algorithmic and visual approaches. These tools enable users to adjust outliers automatically while also retaining the option to review results with human eyes. An analyst can apply a z-score rule across every diagonal in seconds, then scan the colored triangle and 3-D surface to confirm that each flagged cell genuinely warrants adjustment, and that nothing meaningful slipped through.
This pairing matters because outlier adjustment is ultimately a judgment, and judgment benefits from being informed by both scale and context. The algorithm provides breadth and consistency; the visual review provides the context needed to accept or override any individual flag.
The platform further enhances transparency by storing adjustments for documentation, actuarial certification, and communication with external stakeholders. Every change, whether an automatic z-score removal or a manual cell edit, is recorded with its rationale, so the reasoning behind the final reserve can be reconstructed and defended long after the fact.
Wrapping Up#
Outlier adjustments, while simple in concept, sit at the intersection between actuarial judgment and algorithmic identification. The techniques themselves, smoothing factors, zeroing or averaging cells, and filtering source data, are well established and can be automated with straightforward rules. What distinguishes a sound reserve estimate is the discipline applied around those rules: reviewing flagged anomalies for reasonability, deciding case by case whether an adjustment is warranted, and documenting the reasoning behind each choice.
By combining algorithmic detection with visual review and a clear record of every adjustment, actuaries can address anomalies without obscuring the real experience underneath, producing reserve estimates that are both stable and defensible.
Disclaimer: This article reflects the opinions of the IBNR Health Team. It is intended for educational purposes only and should not be relied upon as the sole basis for professional decisions. Readers should exercise independent judgment when making actuarial or financial decisions. Please contact support@ibnrhealth.com if you have feedback or identify any mistakes on this page.